Management Reporter makes it easy to calculate a period average.
Hey I haven’t posted in a while because I’ve been really busy writing my next training guide, Creating Reports in Management Reporter II—Step by Step Instructions on a Dozen More Reports (due out later this week). This post is one of the 20 items from Chapter 15—Top 20 Tips Tricks & Techniques. Here’s a preview of one of the new features I really love.
Use the new Periods function to calculate an average in the column definition
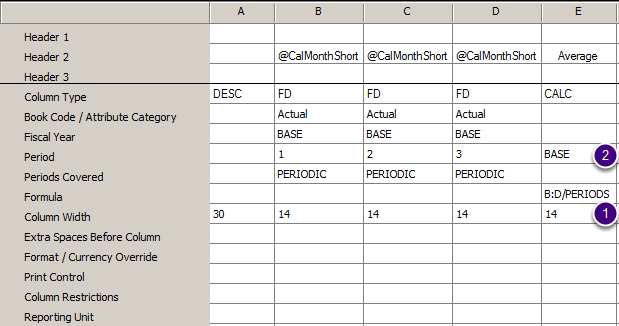
- Use the new ‘Periods’ to divide by the number of periods to calculate an average.
- This column must have something in the Period cell so that ‘Periods’ will know what number to use. I’m using Base here to tell MR to use the Report Definition period.
This new functionality makes calculating averages so much easier than in FRx.
Results
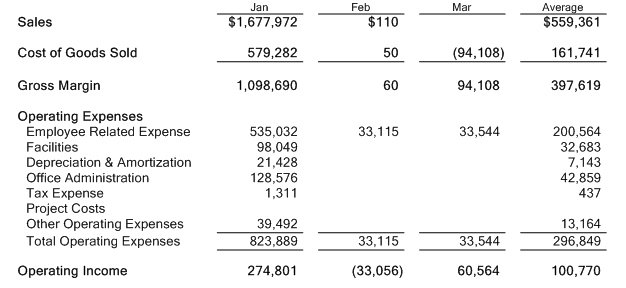
The above column gives these results. Simple.
BTW, this technique works exceptionally well on a Trend column (January through December—exactly like the one in Chapter 2).
Cheers—Jan
If you wanted the MR report to print the average per month based on ytd and current period, is there a way to do that? (YTD/5 when run for period 5, YTD/6 when run for period 6)?
Hi Lisa…yes, you’ve got it, that’s exactly what the Periods function is designed to do. It looks at Base in the Period cell to determine what number to use to divide by. So you can use this with a trend column, with conditional prints, and as long as Base is in the Period cell, it will divide by 5 for period 5 and 6 for period 6. Whether it’s YTD or not will depend on the first part of the calculation. You can use a YTD column to divide by Periods (the new function) and you’ll be good to go.
Jan,
Found your site while researching a question – hope you might be able to offer some suggestions.
I’ve got a report with current year on one row and prior year on a second (repeated for lots of different P&L subtotals/totals on additional rows)
I’ve got the months in the column.
Basically a trend report for multiple years.
I can do the average as you noted for the current year.
How can I get the average for the prior year to show in the same column (or even a different column) on the appropriate rows – since it would be a fixed (ytd/12)? I don’t want to put the current year ytd/12 in the same column since its not meaningful nor do I want the prior year YTD/periods since it too is not a meaningful number.
Essentially I want the average monthly amount for this year and for last year (for the entire year)
Thank you!
Hi Jon…this is the perfect opportunity for a row modifier. In MR, it’s column I. Drop that box down, and you’ll have 3 different opportunities to modify whatever you’re pulling on that row. In this case, you’d use /Y-12 to get to the YTD balance 12 periods ago. The row modifier modifies whatever the column is pulling. You will probably need to use the column restriction in column H to make this show up only in the YTD column and not in the ‘trend’ columns. Once you get that number, then you can divide by 12 to get the average, and go from there. Cheers…Jan
Jan,
I have a customer using the Rolling 12 months column layout. In their rows, they have amounts and percentages. The last column is a sum, which is great for the amounts. They are wanting an average of the percentages though. I have been researching and attempting different items and just not succeeding at a solution that will work in one column.
Thank you in advance for your help!
Zara
Hi Zara…what I’d probably try for your client is column placement. Here’s how to do column placement in FRx, but the technique is essentially the same for MR (but use a period between the column letter and the row number). So you’d nonprint the percentage rows, add a CAL row that does print, and reference the amounts as B=B.1360, C=C.1360, D=D.1360/12 (where D is the total column). You might have to monkey with the calculation priority too. Hope this helps…Jan
Hi Jan! What is the best way for calculating an average within a row dimension? i.e. my company uses a weighted average shares calculation and I can’t seem to get it to work properly. Also if this is able to be fixed, is there a way to get data from different rows to merge and only show as one row on the report itself? For example, in this case, we will be calculating the average for the current figures, however, our next column is for the budget which is already set in value and does not need these calculations. We would like to be able to have the calculated current amount in row X and column A and then the uncalculated budget amount in row X, column B.
Hi Amy! If I’m reading you right, you’re talking earnings per weighted average of outstanding shares. You can of course get the earnings part from MR, but the weighted average of outstanding shares, not so much. It would need to be pulled into MR either by a link to Excel or by a statistical account in your ERP (like a unit account in GP for instance). Once you get MR to pull in your already-calculated weighted average of number of outstanding shares, then you can use it on a CAL row to calculate earnings per share. Re the 2nd part of your question, about not wanting it to appear in the Budget column, you can use column H in the ROW to restrict which columns actually print. It’s called Column Restriction, and you put the columns in there that you DO want to print. Good luck! Jan
Excellent! I will try the Excel linked file since that is where we currently reconcile.
For the second item, I guess it’s hard to explain!!! I’m looking to combine data in one single row for multiple columns. For example, if I have the shares tie to the excel file in one row and then the budget pulling from the GL in another row, is there a way to combine the two rows so the data is all on the same line instead of having to separate out because they are calculated differently?
Sounds like you’re looking for column placement. Do a search in the top right corner (this site) for column placement. You’ll find info on column placement in FRx, but the technique is the same for MR with a little different syntax. Instead of E=C1360 as in FRx, you’ll use E=C.1360 in MR. Only difference is the dot between the column letter and the row number. Hope that will get it for you. Jan
PS. You should know that the downside to column placement is that now your row def can only be used with that one single column def. So you give up some flexibility.
Awesome, I’ll take a look!! Thanks for all of your help :)
Hi Jan. I love your site! I am creating an income statement that will have a column for each month, YTD, and the total year. It will show actual and projection. I would like to have the number of business days (M-F minus Holidays) of each month to print at the top, just under the month name.
Is there a way to calculate the number of business days in a month?
Thanks in advance,
Eric
Hey Eric thanks re site! Short answer no for both FRx and MR. Better answer: guessing Excel has a function that would calculate this, then you could hard code them in under the month in each column heading, or use column placement to put the numbers in the body of the report if you want to use them in calculations. You can hard code a value in a CAL row with this formula: a=21, b=20, c=22, etc (where a is column a for the 1st period and 21 is the number of business days, b is period 2, etc). And if you put them in the row, be sure to use column E Format Override to format to lose the decimals. Good luck…Jan
PS. One more thing…anytime you use a CAL row in the row definition and have a CALC in the column definition, you should check the intersection and see if you get results you expect. If not, change the calculation priority in the Settings tab in the report definition.
Hi Jan, I have a situation where I use several unit accounts in my financial reports. My columns are as follows: Period – FD, Per Mile – Calc, YTD – FD, YTD per Mile – Calc.
I would like to see an YTD average rather than YTD sum in my YTD column for several of the unit accounts, while still having the sum total for everything else in the column. Is this possible in MR?
From your wonderful instructions I have been able to learn how to calculate a whole row of averages, but that’s not quite what I am after. Even if I could leave the YTD-FD column as the sum for the year and could some how use the period for my CBR, I could set the CBR for the first few rows and have the average in my calc column. I seem to be struggling to bring any plan of attack to fruition, any guidance would be appreciated!
Thanks,
Duska
Hi Duska! I’m hoping someone else will respond. I’m toast: mostly retired and up to my ears in company in the beautiful historic musical city of New Orleans! Laissez les bon temps rouler, cher! Jan