I've done a lot of work for nonprofits over the last couple of years, and I've come to one conclusion—they're all different! Just like for-profit companies, they each have their own idiosyncracies and their own reporting requirements. What a surprise, huh. But there are some … [Read more...]
How To Create a Pivot Table from an FRx or MR Report
A Pivot Table is an extremely powerful feature in Excel, one that is probably underutilized in many companies. It's just so cool to be able to move 'tiles' around and analyze your data a jillion different ways. Even though pivot tables can be sort of intimidating, they're not … [Read more...]
FRx and Management Reporter News from Convergence
Well OK—Convergence was back in April and now it's June! Sorry—no excuses! So without further delay, here are some of the main discussion points around FRx and Management Reporter. BTW, some discussion was official, some not so official. {smile} Migration from FRx to … [Read more...]
FRx for AX deadline—need more drilldown viewers?
Word on the street is that AX is coming off the price list on April 1, 2011. Heads up—that means that you won't be able to buy more licenses. Maybe more importantly, more drilldown viewer licenses. If you plan to stick with FRx for a while, you've got just a couple of … [Read more...]
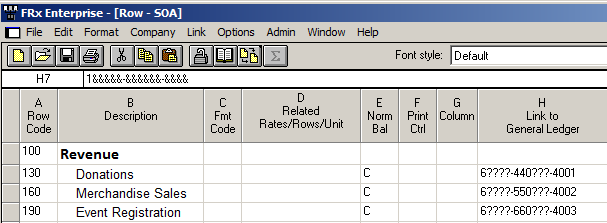
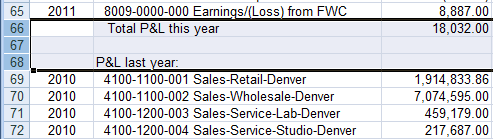
What to do about Accounts that won’t show up in FRx
Got a new account that won't appear on a report? You've added it to your chart of accounts, and to your FRx row format. You know you have data posted to it. But it just won't show up on the report no matter what you try. Same thing for new budget book … [Read more...]
- « Previous Page
- 1
- 2
- 3
- 4
- …
- 20
- Next Page »